When we talk about busy jobs, being a sales rep must be in the top five. Salespeople are swamped with tasks: arranging meetings, making phone calls, preparing presentations, and closing sales. On top of that – they need to reach their sales targets!
If you’re a sales rep trying to navigate your way through multiple tasks, you will benefit from easy-to-use SuperOffice dashboards that can help you get a clear picture of what’s happening with your sales right now and take forecasting and reporting off your to-do list.
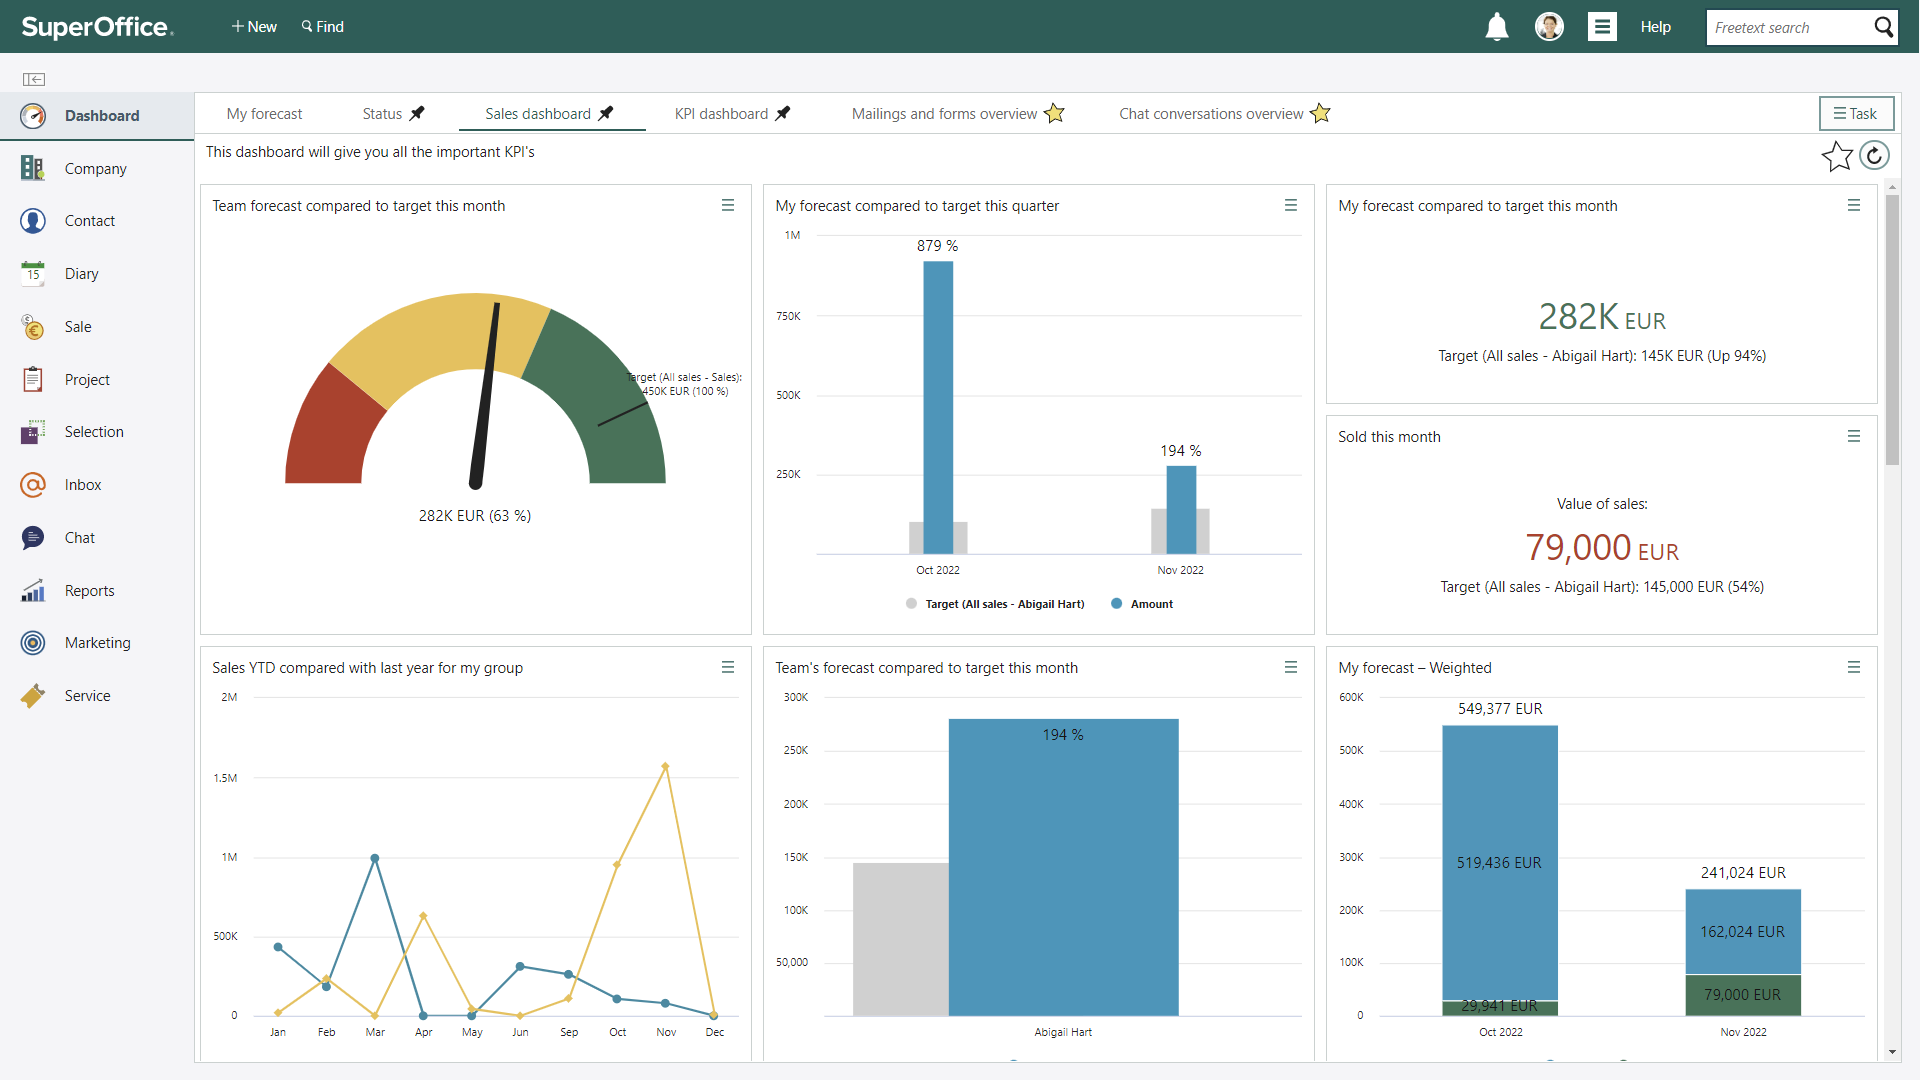
SuperOffice dashboards can be compared to the dashboard panel in your car. It gives you all the key information you need, like your speed and how much petrol is left in the tank. Similarly, dashboards show you how much you have sold and how many open sales you have in your pipeline.
4 reasons why SuperOffice dashboards are a sales rep’s best friend
Just like the fuel gauge and the speedometer in your car, SuperOffice dashboards are precise and unbiased indicators that tell you how you are performing on a day-to-day basis.
Here are 4 reasons why we think you’ll want to use SuperOffice dashboards.
1. See how you’re progressing toward your goal
With SuperOffice dashboards, you can check how you are performing in terms of your sales target. This means, that you can evaluate your progress and make corrections if needed. The dashboards will tell you when you have to increase the number of new sales opportunities or when you need to focus on closing more deals to reach your budget.
2. Get a 360° overview of your sales
You can use your dashboards to look at your sales information from different angles.
For example, you can look at the progress of your sales performance, by comparing this month’s sales to the sales from last month, or to the same month last year.
You are also able to check your planned activities for this week and next week compared to the number of activities you already completed this month to make sure your activity level is where you want it to be.
3. Visualize your sales progress at a glance
Dashboards are great because they can help you instantly visualize the state of your sales. Meaning, that in just a few clicks you can see your sales numbers in the shape of pie charts, bar charts or simple-to-understand numbers.
Some dashboards will even change color as you reach or surpass your sales targets.
4. Personalize your dashboards to reflect your needs
Every sales rep is different and nobody works in the same way. However, there is one thing that unites them all – all salespeople can benefit from using dashboards, which can be tweaked according to your personal preferences.
Like with everything else in SuperOffice CRM, you are able to personalize your dashboards to access the exact information that you need. You can make a copy of any of the available dashboards, to change them so you can use them the way you prefer.
There are several ways in which you can personalize your dashboard. You can, for example:
- Change the name of your favorite dashboards;
- Use your dashboard in a different language;
- Change the dashboard to show your own sales only, instead of those of the entire team;
- Change the number of items shown. So you can see the top 10 upcoming sales instead of the top 5 upcoming sales;
- Change the period for which the dashboard shows you your data. This way your dashboard will show you your sales per quarter instead of per month; or
- Create a completely new dashboard where you decide which type of chart and data source you want to use.
Boost your sales with our top 5 dashboards
Dashboards are very versatile, but which dashboards are the best for a salesperson to use on a daily basis to help meet sales targets?
To answer this question, we asked our own salespeople for their opinion.
Here are the top five dashboards they chose.
#1: My forecast
Anyone who has worked in sales will agree – reaching your sales target month after month is a big challenge.
To reach your monthly budget it is important to focus on how much you have sold already, as well as the number of open sales opportunities still available to you. At the same time, you want to look into the future to make sure you have enough qualified leads to work with next month.
The dashboard called My forecast will show you the following sales numbers:
- How much you sold last month;
- How much you already sold this month;
- How many open sales opportunities you still have available;
- How many open sales opportunities you have to work with next month.
The total amount of open leads will show you whether or not you will reach your budget this month.
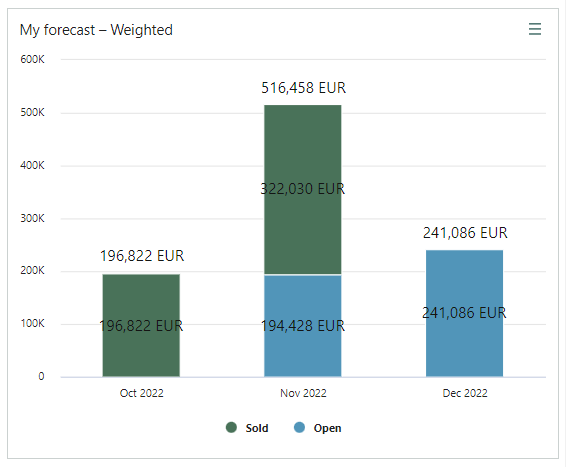
This dashboard also shows you the total value of the leads you will be able to work with next month. You can see the exact number of leads and the total value of these opportunities.
It is a great indicator that will tell you whether you can focus on closing or whether you should focus on finding more prospects.
#2: My pipeline in numbers
When you drive on the highway, you are able to check how fast you are going by checking your car’s dashboard. With one look you know if you are within or above the speed limit. You can do exactly the same in SuperOffice.
The dashboard My pipeline in numbers shows you the speed of your pipeline – which is demonstrated by the total value of the sales currently in your pipeline. You only need one look at this number to know whether it’s high enough to reach your sales budget for this month.
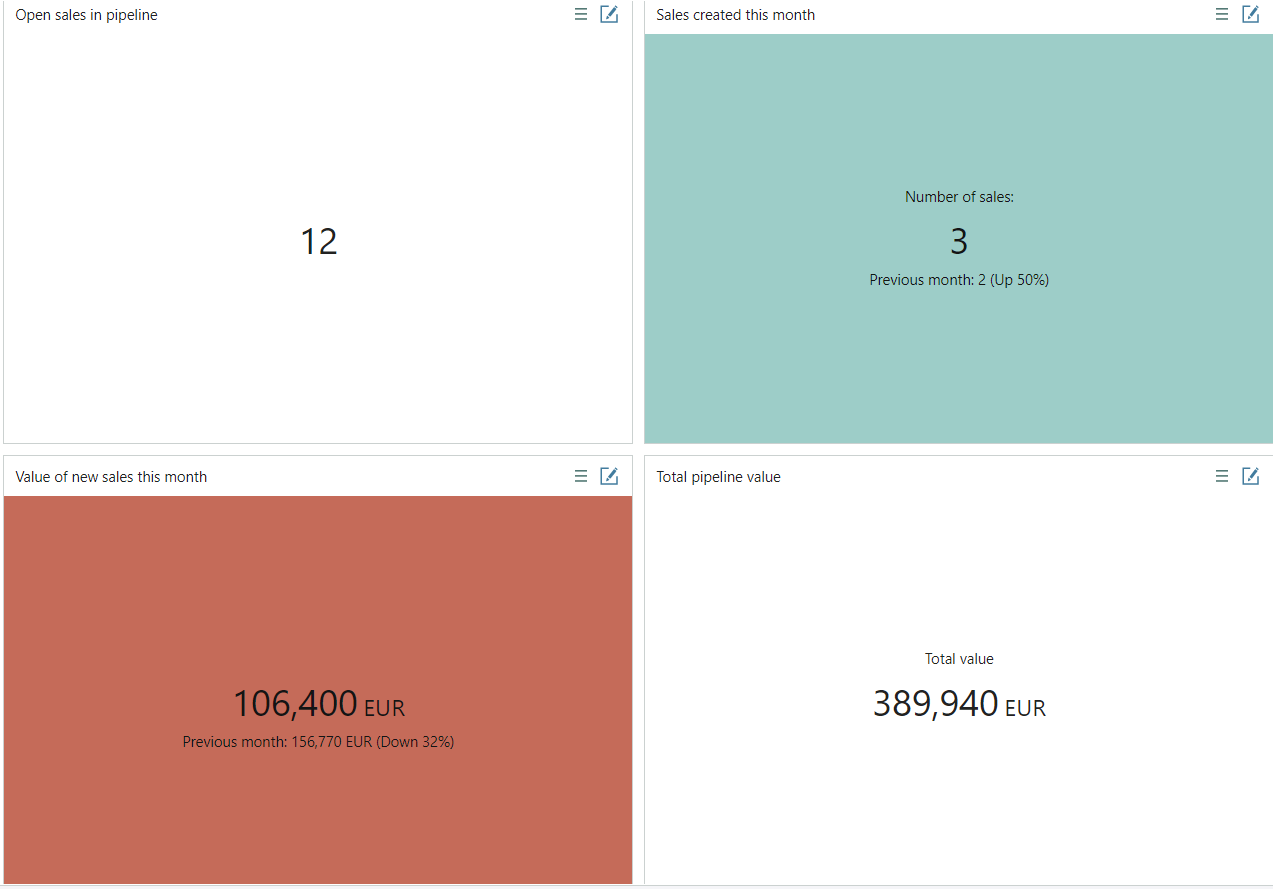
This dashboard will also inform you about the number of new sales opportunities you have created this month and what their combined value is. By regularly checking these numbers you can make sure you have added enough qualified leads to fill up your pipeline for this month and the months to come.
#3: Largest upcoming sales
As cliché as it sounds, it’s true: bigger deals will make you reach your sales target faster.
To help you focus on big deals, you can use the dashboard Largest upcoming sales.
This dashboard will give you a list of the five biggest sales opportunities in your pipeline. The list is ranked by the size of sales and it tells you when you expect your customer to make their final decision.
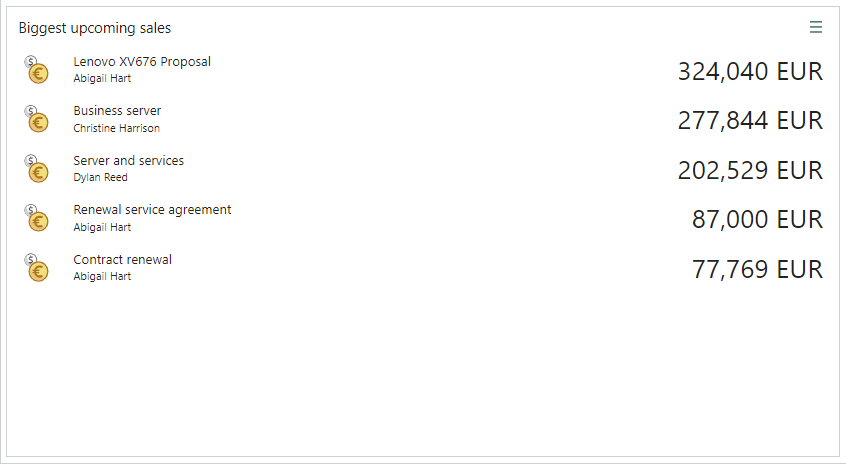
This way, you will know exactly which deals you should prioritize. From the list with the largest upcoming sales, you can go directly to your priority sale and see which follow-up activities you have planned and whether you have sent the customer a sales proposal or not, for example.
#4: My activity pace
Fact – there isn’t a CRM system on the market that will magically fill up your pipeline every month.
So it’s up to you to make sure you have the right balance between closing deals, giving presentations, and starting new sales opportunities to be able to reach your sales target next month or next quarter.
The dashboard My activity pace will help you keep track of how you use your time, by showing which type of activities you use on a weekly basis.
It’s easy to see whether you use certain activities more frequently than others. When you have a large number of closing meetings, for example, but only a few first time meetings with new prospects you can decide which activities you want to prioritize to balance out your activities.
The chart will show you exactly how many meetings (internal or external), follow-ups, lunches, phone calls and proposals you have registered per week. By adding the colors it’s easy for you to see which type of activities you registered the most.
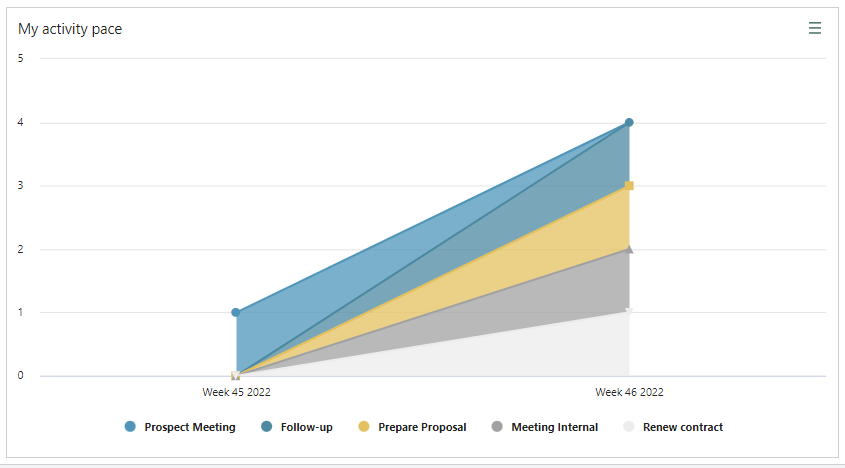
This way you can make sure you fill up your pipeline again. Otherwise, you might run the risk of not reaching your target the next few months.
#5: Sales YTD compared to last year
Working as a sales rep is one of the most competitive jobs there is. Not only do you try to beat your competitors, but you also need to outperform your colleagues. And most importantly – you are always competing against yourself.
The dashboard Sales Year-To-Date compared to last year will help you keep track of your progress month after month. It’ll be easy to see how well you are performing against last year's sales numbers.
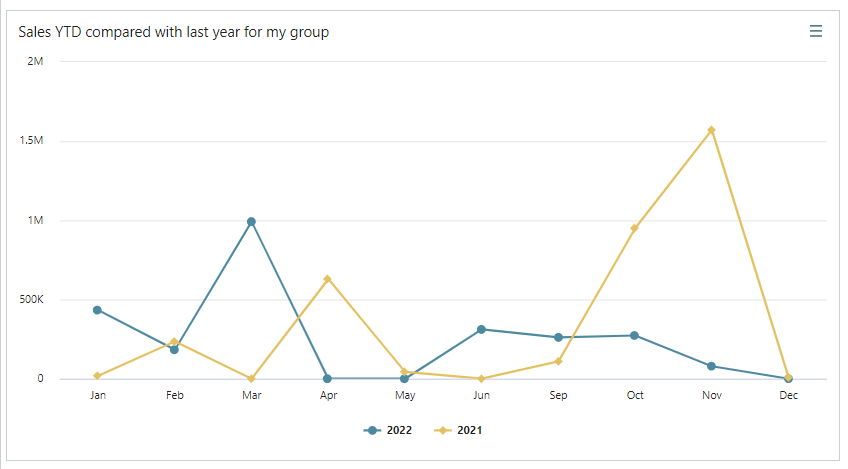
Try to keep the yellow line (this year’s sales numbers) above the blue line (last year’s sales numbers) as often as you can and you will be among the top sellers in your team.
Use your dashboards directly on your phone
There are many reasons why you should use the mobile app, Pocket CRM. One of them being that you will have access to all of your favorite dashboards.
Whether you are on the road or at home, you can check the status of your pipeline or your current activity level directly on your mobile device.
This way you will be able to stay in control of your sales 24/7.
Learn more about SuperOffice CRM on your mobile.
Choose your favorite dashboard and let us know about it
SuperOffice dashboards truly are a great tool to stay in control of all your open sales during a busy workday.
By using these dashboards, or any of the dashboards SuperOffice has to offer for that matter, you don’t have to spend time on creating forecasts or reporting.
In addition, SuperOffice dashboards will help you prioritize your daily tasks, such as which sales to follow up on and what activities to focus on next, so you are in the best possible position to reach your ambitious sales targets.
We created this list of top five dashboards based on the opinions of our sales team. But what about your sales team? Which dashboard is the most useful for your business?
Feel free to use the comment section below to share which dashboard is most useful in your opinion, and why this dashboard is your favorite.