These changes are part of our ongoing effort to modernise the SuperOffice user interface and technology, ensuring you have the best tools for your business needs. As a result of these enhancements, Reports - the legacy reporting tool will be retired on December 4, 2024, for our Online customers.
This change allows us to focus on delivering modern, dynamic reporting options that offer more flexibility and better performance.
If you’ve been using Reports, you’ll need to transition to the new tools by mapping your reports and recreating them using Selections.
Here’s everything you need to know to transition smoothly and make the most of the new features.
What’s New?
With these new ways of working with data, you’ll be able to:
- Customise Selections: Adjust columns, group data, and apply calculations (sum, average, etc.) for more tailored overview.
- Create dynamic Dashboards: View real-time insights with drill-down capabilities, and export or print tiles as needed.
- Print or Export: Customise your print overview or export your data for more detailed analysis and formatting using Excel's advanced features.
New Features:
- Column calculations (sum, average, etc.) in Selections and Find.
- Customise selection columns for printing or saving to PDF. (from version 10.3.11)
- Print labels directly from Company/contact section tab in Selection.
- Print company information directly from the Company card (or any other main screen in SuperOffice).
How to customise selections and preview for printing
With the new options in selections, you can tailor the data you want to include in your reports and customise the layout before printing or exporting.
Here’s how to preview and fine-tune your reports:
- Begin by using Find and Selection to get the data you need. Set specific criteria to refine your search.
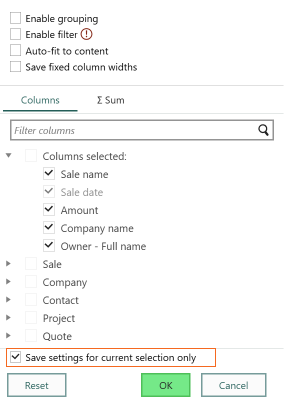
- Configure columns: Select the fields you want to include in your selection (e.g., company name, contact info, sales amount), and group data as needed for a clearer view. PS! It’s only the first five columns that will be shown for the print option.
Tip: Use column calculations like sum, average, max, and min, along with grouping options, to gain real-time insights within the Selection view.
Saving Settings: If you want these column settings to apply only to the current selection (e.g., for this activity report), choose Save settings for current selection only.
Otherwise, changes will affect all selections of this type, such as Follow-ups (activities).
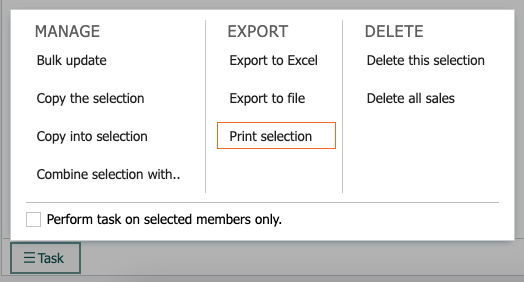
- Customise the layout: After configuring your columns, click the Task button in the Selection or Find search result and choose "Print selection".
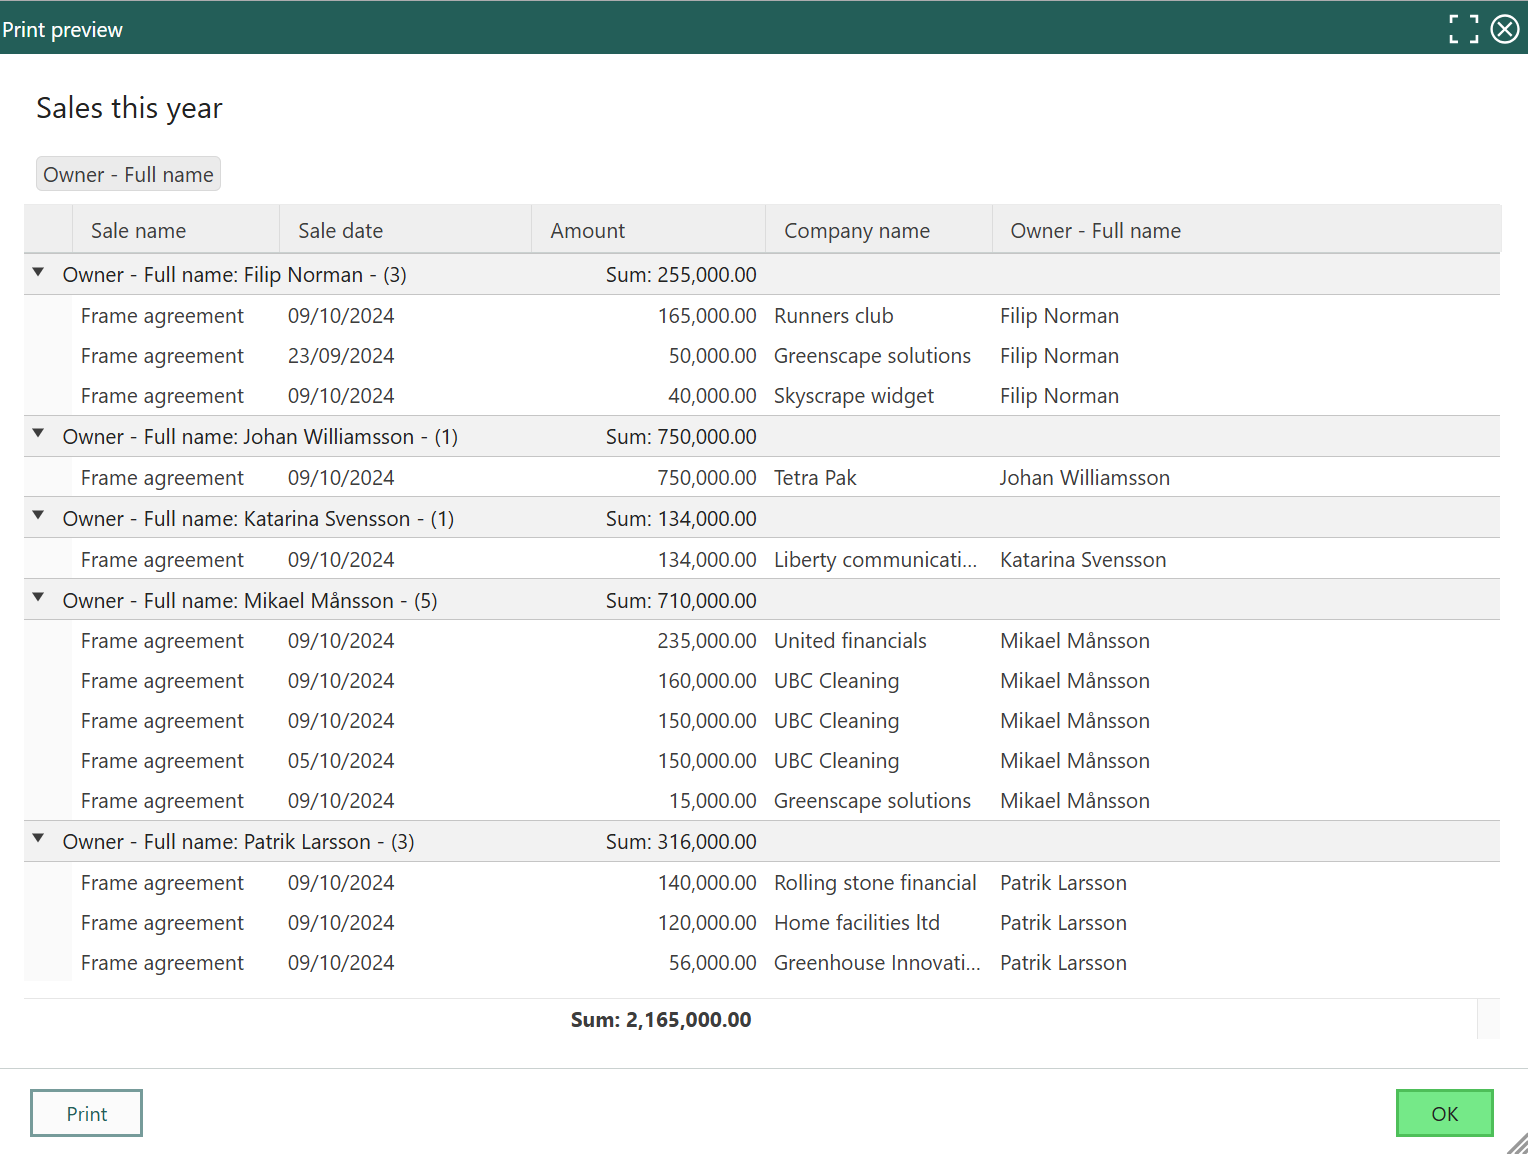
You’ll be able to preview how your report will look berfore print or save as a PDF.
- Preview and Adjust: The first five columns in the selection will be included in the report by default. Groupings and column calculations (e.g., sums) will appear in the print preview, allowing you to see how your data will be presented.
- Print: From the preview, you can either print the report or save it as a PDF.
- Export: If you need more customization, you can export the Selection to Excel for further adjustments.

What will happen to my old reports?
Your existing archived reports will remain available as PDFs in SuperOffice:
- Reports connected to companies or contacts will be accessible through their respective tab sections.
- For an overview of all your old reports, we’ve created a selection called Archived reports made with reporter, where you can access
all your previously generated reports.
If your reports are not linked to a company or contact, we recommend reviewing and organising them before the Reporter tool is fully retired.
Next steps for report users
If you’ve been using Reports, it’s time to transition to the new tools:
- Map your existing reports: Review your saved reports, especially if they include customized criteria.
- Re-create your reports: Use Selections to replicate your reports by applying the same criteria. You can favorite them for easy access later by marking the star icon.
For step-by-step details on using Selections, visit our guides:
- Selections overview
- How to create a Selection
- How to perform tasks using Selections
- How to Customize Columns and Print Selections
- Create a new dashboard
Frequently asked questions
1. How can I save a snapshot of my selections?
You can save a static version of your selection by printing it to PDF or exporting the data to Excel.
These can be archived in SuperOffice for future reference. You can off course also copy the dynamic selection to a static selection and create a logic naming for it.
2. I need cross-table reports (e.g., statistics). How do I get them?
The cross-table (d-cube) format is no longer supported in the new tools.
However, you can export your data to Excel and use pivot tables for advanced analysis, or create visual insights using Dashboards.
3. Can I still print address labels?
Yes, you can print labels directly from Selections, or export the data to Excel and use Microsoft Word to generate custom labels.
For step-by-step instructions, see How to Print Labels.
Need more help?
Our Support team is here to assist you with the transition. Whether you need tips on setting up new reports or have questions about the new features,
feel free to reach out to support@superoffice.com.
